




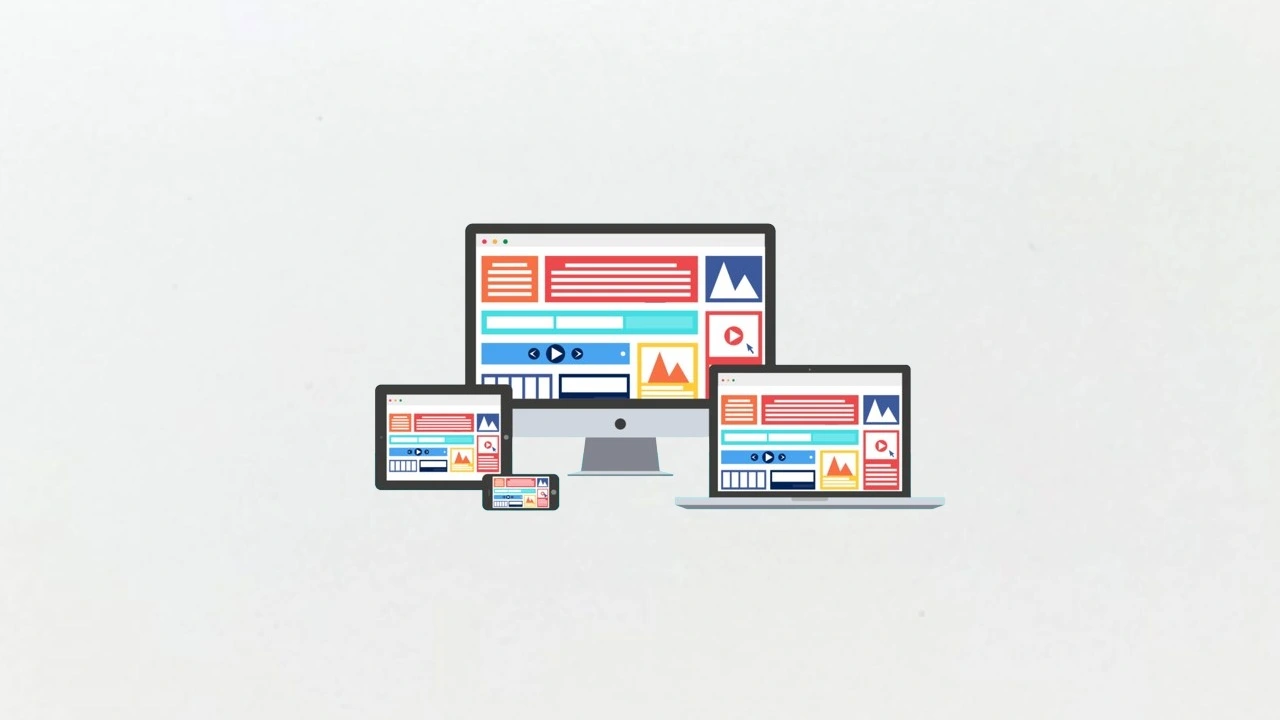
Display advertising is a form of digital paid media that places visual ads, including banner images, native placements, video, and Connected TV spots, across websites, apps, and streaming platforms to reach targeted audiences. Programmatic buying now drives 91% of all US display ad spend per DigitalApplied data. The global display advertising market reached $312.4 billion per Statista. Every business running paid media needs a clear understanding of formats, CPM benchmarks, targeting options, and buying methods before committing budget.
Quick Digital has planned and executed display advertising campaigns for clients since 2014. This guide covers every display ad format, every benchmark by buying method, and every targeting and creative strategy your campaigns need to perform.
Display Advertising vs Search Advertising
Display advertising targets users based on who they are and what they have done before, while search advertising targets users based on what they are actively searching for right now. Search ads capture existing intent. Display advertising creates intent by reaching users before they search.
| Factor | Display Advertising | Search Advertising |
|---|---|---|
| Targeting basis | Audience, behavior, context, location | Keyword intent at search moment |
| Average CTR | 0.046% (GDN) to 0.2-0.5% (native) | 2-5% (varies by industry) |
| Average conversion rate | 0.71% (standard); 1.91% (remarketing) | 4.40% average |
| Primary goal | Awareness, retargeting, upper funnel | Direct response, lower funnel |
| Pricing model | CPM, vCPM, CPC, CPA, attention-based | CPC, CPA, Target ROAS |
| Measurement | Viewability, reach, brand lift, view-through | Click, conversion, ROAS |
Display ads contribute to 35% of conversion paths even when they receive no last-click credit per DigitalApplied data. So measuring display performance on clicks alone misrepresents its true business impact. Use view-through attribution and brand lift studies to capture the full picture.
Display Advertising Formats
Display advertising spans 6 core formats, each with different CPM levels, CTR benchmarks, and use cases across the purchase funnel. The right format depends on your campaign objective, target audience, and available budget.
Banner Ads
Banner ads are static or animated image ads served in fixed ad slots on websites and apps, making them the oldest and most common display format. The 300×250 medium rectangle is the most clicked banner size per Marketing LTB data. The 728×90 leaderboard delivers high viewability but lower CTR. Standard banner CTR on Google Display Network averages just 0.046% across all sizes.
Static banners are losing share. Animated HTML5 banners produce 2x the CTR of static banners per Marketing LTB. Ads placed above the fold see 18 to 30% higher CTR than below-fold placements. Desktop banner viewability sits at 64%, well below the 70% threshold buyers should accept as a minimum from any publisher partner per DigitalApplied data.
Rich Media Ads
Rich media ads use HTML5 to create animated, expandable, or interactive ad units that respond to user actions like hover, swipe, or click. Rich media and animated banners average a 0.18% CTR, 4 times higher than standard static banners per OwlClaw benchmarks. Interactive display formats produce 2 to 4 times higher engagement than static banners per Marketing LTB. The added engagement comes from user participation rather than passive exposure.
Native Advertising
Native ads match the design, format, and tone of the editorial content surrounding them, making them appear as part of the page rather than separate placements. Native display spending reached $98 billion globally per DigitalApplied. Native CTR averages 0.2 to 0.5%, between 4 and 10 times higher than standard banner CTR per OwlClaw. Native inventory also achieves 81% viewability, well above the 64% for standard desktop banners.
Native ads work by reducing ad resistance. Users process them as content rather than interruption. Native-style display ads see 50 to 60% higher engagement than standard formats per Marketing LTB. CPM for native ranges from $5 to $12, higher than open-exchange banners but justified by the engagement lift.
Video Display Ads
Video display ads deliver motion graphics and audio in pre-roll, mid-roll, or out-stream placements across websites, apps, and streaming platforms. Video accounts for roughly 50% of all programmatic spend per Marketing LTB. Programmatic video CTR reaches 1.84% versus 0.08% for standard display per SearchLab benchmarks. Video display ads deliver 2x higher brand recall than static banners per Marketing LTB.
In-stream video on CTV platforms achieves completion rates of 92 to 97% per CTV analytics data cited by SearchLab. CTV CPM ranges from $25 to $45, far higher than standard display, but completion rates and audience attention at that level justify the premium for brand campaigns. CTV display impressions grew 28% year over year per DigitalApplied.
Connected TV and OTT Advertising
Connected TV (CTV) advertising delivers programmatic video ads to households watching streaming content on smart TVs, streaming sticks, and gaming consoles. CTV programmatic is growing 38% year over year per SearchLab data. CTV display reaches 96% viewability, the highest of any display format per DigitalApplied. Ad fraud risk is higher in CTV at 12.4% adjusted fraud rate on open programmatic CTV inventory per DigitalApplied, making verification tools non-optional for any CTV buy.
Dynamic Creative Optimization Ads
Dynamic creative optimization (DCO) automatically assembles personalized ad variations by combining headline, image, copy, and call-to-action elements based on audience signals in real time. Real-time DCO grows conversions by 50 to 120% per Marketing LTB verified data. Brands using DCO see 20 to 60% higher CTRs per Marketing LTB. DCO requires a structured feed of creative assets and audience data inputs, but produces the highest performance ceiling of any display format type.
Display Advertising CPM Benchmarks by Format and Buying Method
CPM rates vary dramatically by format, inventory quality, and buying method. Comparing open exchange CPMs to private marketplace (PMP) CPMs as if they are equivalent is a common mistake that leads to bad media planning decisions.
| Format | Open Exchange CPM | Private Marketplace CPM | Avg. CTR | Viewability |
|---|---|---|---|---|
| Standard banner | $2 to $6 | $6 to $15 | 0.046% | 64% (desktop) |
| Rich media / HTML5 | $3 to $8 | $8 to $18 | 0.18% | 68%+ |
| Native display | $5 to $12 | $10 to $20 | 0.2% to 0.5% | 81% |
| In-stream video | $12 to $25 | $20 to $40 | 1.84% (video CTR) | 90%+ in-stream |
| Connected TV | $25 to $45 | $35 to $60+ | Completion-based | 96% |
Sources: OwlClaw Benchmarks, DigitalApplied, SearchLab, Stackmatix.
PMP deals clear at an average $12.40 CPM versus $5.85 on the open exchange, a 2.1x premium per DigitalApplied. But PMPs deliver 92% viewability versus 71% on the open exchange, and just 1.2% fraud rate versus 8.7% on open exchange. Quality-adjusted cost per viewable impression makes PMP the better buy for brand safe campaigns where wasted spend matters.
Display Advertising Targeting Methods
Display advertising covers 6 core targeting methods, and combining 2 or 3 of them produces stronger audience precision than any single method alone.
Audience Targeting
Audience targeting serves display ads to users based on their demographics, interests, and online behaviors tracked through browsing history, purchase signals, and content consumption. Demographic targeting covers age, gender, household income, and parental status. Behavioral targeting uses in-market audiences that Google, Meta, and DSPs build from observed browsing patterns. Personalization increases programmatic CTR by 1.5 to 3 times compared to non-personalized audience buying per Marketing LTB.
Contextual Targeting
Contextual targeting places display ads on pages whose content matches the advertiser’s product or service category, without requiring any user-level data. Contextual targeting has grown in importance as third party cookies decline. First-party data usage increased 40 to 70% since cookie deprecation announcements per Marketing LTB. Contextual plus semantic targeting is expected to double in adoption per Marketing LTB as advertisers build cookieless audience strategies.
Remarketing
Remarketing shows display ads to users who previously visited your website, watched your video content, or interacted with your app. Remarketing display conversion rate averages 1.91% versus 0.71% for standard display per Gitnux data. Retargeting through programmatic increases ROAS by 2 to 4 times on average per Marketing LTB. Run your remarketing campaigns as a dedicated line item separate from prospecting to accurately measure the performance gap between audiences.
Geotargeting
Geotargeting restricts display ad delivery to users within a defined geographic area, ranging from a country down to a specific city, neighborhood, or radius around a point of interest. Local businesses use radius targeting to reach users within 5 to 20 miles of a physical location. National brands use regional targeting to weight spend toward markets where they have stronger distribution or where competitive pressure is highest.
First Party Data Targeting
First-party data targeting uses your own customer records, such as email lists, CRM data, purchase history, and website behavioral data, to build display advertising audiences directly. Email-based audience matching reaches 60 to 85% match rates per Marketing LTB. Upload customer email lists to Google Customer Match, Meta Custom Audiences, or a DSP’s data onboarding tool to reach existing customers across display inventory. First-party audiences consistently outperform third party cookie audiences on every conversion metric.
Lookalike Audiences
Lookalike audiences expand your reach by targeting new users who share behavioral and demographic traits with your best existing customers. Both Google’s Similar Audiences feature and Meta’s Lookalike Audiences tool build these algorithmically from a seed audience you supply. Lookalike audiences based on your remarketing pools convert 45% better than standard interest targeting per Marketing LTB data. Use your top-spending customers or your most recent converters as the seed for the highest-quality lookalike expansion.
Programmatic Display Advertising: How the Buying Works
Programmatic advertising automates display ad buying through algorithms and real time auctions, replacing manual negotiation between advertisers and publishers. Programmatic now drives 91% of US display spend and roughly 90% of global digital display investment per DigitalApplied. Understanding the 3 programmatic buying types prevents overpaying for open exchange inventory when higher-quality options exist.
Open Exchange RTB
Open exchange buying uses real time bidding (RTB) to purchase ad impressions in millisecond auctions across millions of publisher websites simultaneously. Open exchange CPM averages $1 to $4, the cheapest programmatic inventory available. The tradeoff is quality. Open exchange delivers 71% viewability, an 8 to 15% invalid traffic rate, and limited brand safety controls. Active pre-bid filtering through tools like DoubleVerify, Integral Ad Science (IAS), or HUMAN Security catches an estimated 73% of invalid traffic before bids fire per DigitalApplied data. Run open exchange only with pre-bid filtering active.
Private Marketplace Deals
Private marketplace (PMP) deals give advertisers preferred access to specific publisher inventory at negotiated CPMs, combining programmatic efficiency with direct-buy inventory quality. PMP CPM averages $6 to $15 compared to $2 to $6 on the open exchange per OwlClaw. The quality premium produces 92% viewability, 1.2% fraud rate, and measurably better brand safety per DigitalApplied. For brand campaigns where placement context and audience quality matter, PMP is the preferred buying method over open exchange.
Programmatic Guaranteed
Programmatic guaranteed purchases fixed inventory at a fixed CPM directly from a publisher but executes automatically through DSP infrastructure. CPM ranges from $12 to $25 per Stackmatix data. Programmatic guaranteed is the digital equivalent of direct IO (insertion order) buying, carrying all the placement certainty of a direct buy while removing manual trafficking steps. Use it for premium publisher partnerships where guaranteed placement matters more than auction price efficiency.
Display Advertising Platforms and DSPs
Three demand side platforms (DSPs) dominate global programmatic display spending. Choose the right one based on your inventory priorities and existing marketing technology stack.
Google DV360
Google Display and Video 360 (DV360) commands 32% of global DSP spend and provides the deepest integration with Google’s owned inventory, including YouTube and the Google Display Network. DV360 works best for campaigns that need cross-channel reach across Google Search, YouTube, and display together. Google Display Network reaches over 90% of internet users across more than 2 million sites and apps. Run PPC management and display together inside Google’s ecosystem for unified audience sharing between search and display campaigns.
The Trade Desk
The Trade Desk holds 19% of global DSP spend and leads in premium CTV and open-internet inventory access outside the Google walled garden. Trade Desk’s Unified ID 2.0 (UID2) provides a cookieless identity solution for targeting and measurement as third party cookies decline. For campaigns prioritizing CTV, streaming audio, and digital out-of-home (DOOH) alongside display, The Trade Desk handles all formats from one platform with transparent supply chain reporting.
Amazon DSP
Amazon DSP controls 14% of global DSP spend and is the fastest-growing top-five DSP at 24% year over year growth per DigitalApplied. Amazon DSP’s unique advantage is purchase intent data. Targeting users based on product category browse history and actual purchase behavior on Amazon produces stronger conversion rates for eCommerce advertisers than standard behavioral targeting available in other DSPs. Amazon DSP reaches inventory both inside Amazon’s properties and across third-party websites and apps.
Meta Audience Network
Meta Audience Network extends Facebook and Instagram targeting capabilities to display inventory inside third-party mobile apps and websites. Meta platforms command 28% of social display spend per Gitnux. For campaigns already running on Facebook, Audience Network expands reach beyond Facebook and Instagram while maintaining the same Custom Audience and Lookalike targeting precision. Facebook marketing audiences built from your pixel data transfer directly into Audience Network campaigns.
Display Ad Creative Strategy
Creative quality is the variable with the highest marginal impact on display advertising performance after audience targeting. Buying high-quality inventory with weak creative produces worse results than buying average inventory with strong, personalized creative. DCO and creative refresh schedules both sit above bidding strategy in terms of optimization priority.
Ad Creative Specifications by Format
| Ad Format | Top Performing Sizes | File Size Limit | Key Creative Rule |
|---|---|---|---|
| Banner | 300×250, 728×90, 160×600, 320×50 | Under 150KB | Single clear CTA, high contrast |
| HTML5 Rich Media | 300×250, 728×90 animated | 200KB initial load | Animation under 15 seconds, loop max 3x |
| Native Display | Title: 25-90 chars, Image: 1200×628 | 1MB image | Match editorial tone, no branded borders |
| In-Stream Video | :15, :30 skippable or non-skippable | MP4 under 500MB | Brand visible in first 5 seconds |
| Responsive Display Ad | Google auto-assembles from assets | 5MB per image | Supply 5+ images, 5+ headlines |
Dynamic Creative Optimization Setup
DCO requires 3 inputs: a creative asset library organized by element type (headline, image, CTA, background), an audience data feed that supplies the targeting signal for personalization, and a DCO platform that assembles combinations at bid time. Google Responsive Display Ads provide a simplified entry point to DCO. Enterprise advertisers use dedicated DCO platforms like Jivox, Flashtalking (now Mediaocean), or Innovid for more granular personalization logic. AI-generated display creatives are growing at 70% annually per Marketing LTB as generative tools cut production costs by 60 to 90%.
Creative Refresh Cadence
Refresh display creative every 3 to 4 weeks to prevent ad fatigue from degrading performance. Cap frequency at 5 to 7 exposures per user per week per Stackmatix recommendations. When frequency stays high and CTR drops below 50% of its initial level, the creative has fatigued. Rotating 3 to 5 creative variants simultaneously slows fatigue by distributing exposures across different messages rather than repeating the same ad.
Ad Fraud, Viewability and Brand Safety in Display Advertising
Ad fraud costs the display industry billions annually and sits at 8 to 15% invalid traffic rate on open exchange inventory without verification tools active. Good DSPs reduce IVT to 2 to 3% per OwlClaw benchmarks. CTV fraud is the fastest-growing problem, with open programmatic CTV invalid traffic running at 12 to 18% in US markets per DigitalApplied and Digital Advertising AI data.
Verification Tools for Display Campaigns
Run pre-bid filtering on every programmatic campaign. The 3 leading verification vendors cover different components of fraud and brand safety:
- DoubleVerify (DV): pre-bid blocking of invalid traffic, brand safety category filtering, and viewability measurement with IAB and MRC-compliant reporting
- Integral Ad Science (IAS): brand safety targeting, viewability optimization, and attention scoring across all major DSPs
- HUMAN Security: specialized in sophisticated bot detection, particularly for CTV where device ID spoofing is growing
Pre-bid filtering through these tools catches 73% of invalid traffic before bids fire per DigitalApplied data. Ads.txt and sellers.json compliance, now required by 65% of buyers per Marketing LTB, authenticates the supply chain so buyers know which publishers actually own the inventory they are selling.
Viewability Standards
The IAB and MRC define a viewable display ad as one where at least 50% of the ad’s pixels are visible on screen for at least 1 continuous second. For video, the standard is at least 50% of pixels visible for at least 2 continuous seconds. Cross-network viewability averaged 72% per DigitalApplied. Any supply partner reporting below 60% viewable should be renegotiated or removed from your media plan. Viewable CPM (vCPM) pricing models charge only for impressions that meet the viewability standard, removing the guesswork from impression quality.
Display Advertising and the Cookieless Future
Third party cookie deprecation in Chrome, combined with existing Safari and Firefox tracking prevention, has already reduced addressable display inventory by 30 to 40% for cookie-dependent campaigns. Advertisers still relying on third party cookie audiences are working with a shrinking, lower-quality data pool. The shift to first party data and contextual targeting is not optional. It is the current operating environment.
Cookieless Targeting Alternatives
The main cookieless identity solutions currently active across the programmatic ecosystem:
- Google Privacy Sandbox cohort signals: topic-based audience categories inferred from browsing behavior without individual user tracking
- Unified ID 2.0 (UID2): email-based hashed identifier system built by The Trade Desk, supported by major publishers and DSPs
- LiveRamp RampID: authenticated identity graph connecting first party data across publishers and platforms
- Contextual and semantic targeting: page-level content analysis that targets based on what users are reading, not who they are
- Clean rooms: privacy-safe environments where brands and publishers match first party data without sharing raw customer records
Measuring Display Advertising Performance
Display advertising measurement requires tracking beyond clicks because clicks represent a fraction of display’s actual business impact. The industry is moving from click-based and viewability-based measurement toward attention metrics that capture the quality of the impression rather than just whether the ad was technically visible.
Key Display Advertising KPIs
| Campaign Goal | Primary KPI | Industry Benchmark | Secondary Signal |
|---|---|---|---|
| Brand Awareness | Viewable impressions and reach | 70% viewability minimum | Brand recall lift (target 15-30%) |
| Audience Building | CPM and frequency | $2-15 CPM by inventory tier | 5 exposures for measurable brand recall |
| Retargeting | View-through conversion rate | 1.91% remarketing CVR | Return visit rate |
| Direct Response | Cost per acquisition (CPA) | Varies by industry | ROAS target 3.2x (eCommerce avg) |
| eCommerce | ROAS | 3.2x average | Revenue per thousand impressions (RPM) |
Attribution for Display Campaigns
Last-click attribution assigns no value to display impressions that influenced a conversion but did not receive the final click. Display advertising contributes to 35% of conversion paths under multi-touch attribution models per DigitalApplied. Use view-through conversion windows (typically 1 to 7 days for display) alongside post-view incrementality studies to measure true display impact. Only 41% of marketing teams use attribution modeling to measure ROI per Search Engine Land, leaving a large opportunity for brands willing to build proper measurement frameworks.
Attention Metrics
Viewability measures whether an ad could have been seen. Attention metrics measure whether it was actually noticed. Vendors like Adelaide, Lumen Research, and IAS Attention provide attention scores that factor in time in view, scroll velocity, audio on or off, and eye tracking data. Attention metrics are not yet universally standardized but are gaining adoption as buyers seek quality signals beyond basic viewability compliance.
Display Advertising Strategy for Different Business Goals
Display campaigns built around specific funnel stages outperform generic always-on campaigns by a wide margin. Structure your strategy by objective rather than treating all display inventory as equivalent.
Upper Funnel Brand Campaigns
Upper funnel display builds reach and frequency against new audiences who have not yet engaged with your brand. A 5-impression campaign produces a 15 to 30% brand recall lift per OwlClaw data. Run native and video formats for upper funnel work. Use Private Marketplace inventory on premium publishers for brand safety and viewability quality. Measure success through brand lift studies, not click-through rates.
Mid Funnel Engagement Campaigns
Mid funnel display targets users who showed early interest, such as those who visited your blog or watched part of a video, but have not yet converted. Serve educational or product-specific creative. Interactive formats, such as polls and quizzes embedded in the ad unit, see 3 times higher engagement than static formats per Marketing LTB. Link mid-funnel display campaigns to content marketing assets that educate and qualify rather than pushing a direct sale.
Lower Funnel Conversion Campaigns
Lower funnel display focuses on cart abandoners, product page viewers, and users who started but did not complete a conversion. Use DCO to serve personalized creative showing the exact product or service they viewed. Run these campaigns on PMP inventory for viewability quality. Connect display retargeting to your landing page optimization work so returning visitors reach pages built for conversion rather than generic homepages.
Display Advertising and Mobile
Mobile programmatic advertising accounts for 75 to 82% of total programmatic impression volume and outperforms desktop by 33 to 68% across all creative formats per Focus Digital data. Vertical video formats outperform horizontal by 30 to 80% depending on platform. In-app display accounts for 70% of mobile programmatic impressions per Marketing LTB. Mobile display requires mobile-first creative with large tap targets, minimal text, and vertical orientation as the default design.
All display campaigns benefit from fast-loading destination pages. Run your display traffic to pages that pass Core Web Vitals with an LCP under 2.5 seconds. Our guide to page load speed optimization covers the technical fixes that prevent display ad spend from being wasted on slow landing pages. For full mobile campaign strategy across display, search, and social, read our mobile marketing guide.
Supply Path Optimization
Supply path optimization (SPO) reduces the number of intermediary auction layers between an advertiser’s DSP and the publisher’s actual inventory, cutting both cost and fraud risk. Removing unnecessary supply chain hops reduces CPMs by 10 to 20% without changing targeting or creative per Stackmatix data. Most DSPs let buyers configure preferred supply paths to specific publishers, bypassing reseller tiers that add cost without adding value. Header bidding adoption among the top 1,000 publishers reached 76% per DigitalApplied, increasing competition for premium inventory and making supply path selection more consequential.
Display Advertising Campaign Setup Checklist
Follow these steps before spending budget on any new display campaign.
- Define the campaign objective. Brand awareness, retargeting, or direct response campaigns all require different formats, targeting, and measurement approaches. Set this first.
- Select inventory type and buying method. Choose open exchange for scale at low CPM, PMP for quality at premium CPM, or programmatic guaranteed for specific publisher placements.
- Choose your DSP and activate pre-bid filtering. Connect DoubleVerify or IAS for brand safety blocking and IVT filtering before the first impression serves.
- Build audience segments before setting creative live. Separate remarketing from prospecting. Separate high-value past customers from general site visitors. Each segment needs different messaging.
- Produce creative in all required sizes. At minimum: 300×250, 728×90, 160×600, 320×50 for standard display. Add responsive display ad assets for Google campaigns. Prioritize animated HTML5 over static for CTR performance.
- Set frequency caps from day 1. Cap at 5 to 7 exposures per user per week. Without a frequency cap, your ads will over-serve to a small audience subset while most of your target audience sees nothing.
- Configure conversion tracking and attribution. Set up view-through conversion windows. Connect your display platform to your CRM or analytics tool for cross-channel attribution. Review the ad rank and auction mechanics guide to understand how display bids interact with other paid media in the same user session.
- Schedule creative refresh at 3 to 4 weeks. Add this to your campaign calendar before launch. Do not wait for performance to drop to refresh creative.
For display campaigns integrated into a broader search engine optimization and paid media plan, Quick Digital manages full-funnel campaign architecture from audience building through to conversion measurement. Start at quickdigital.org/free-a-quote.
Frequently Asked Questions About Display Advertising
Display advertising CPM ranges from $2 to $6 on the open exchange, $6 to $15 in private marketplaces, and $25 to $45 for Connected TV placements per OwlClaw and Stackmatix benchmarks. Native display CPM runs $5 to $12. The right CPM target depends on your audience quality requirements, viewability standards, and campaign objective. Brand campaigns often justify PMP CPMs because the quality-adjusted cost per viewable impression is lower than open exchange with its 8 to 15% IVT rate.
Programmatic display advertising uses automated real time bidding (RTB) to purchase ad impressions in millisecond auctions through a demand side platform (DSP). The DSP evaluates each available impression against your campaign’s audience, viewability, and budget parameters and submits a bid automatically. Programmatic now captures 91% of US display spend. Buying types range from open exchange RTB at the lowest CPM to private marketplace deals and programmatic guaranteed at higher CPMs with better inventory quality.
Display advertising targets audiences through 6 methods: demographic targeting, behavioral targeting, contextual targeting, geotargeting, first-party data audiences, and lookalike modeling. First-party data targeting using your own customer emails and CRM records consistently outperforms third-party behavioral targeting on conversion rate. As third-party cookies decline, contextual targeting and first-party data are replacing cookie-based audience buying as the primary targeting foundation per Marketing LTB data.
Display advertising drives conversions through view-through attribution, which credits display impressions that influenced a purchase even when the user did not click the ad. Average display CTR is 0.046% but display ads contribute to 35% of conversion paths under multi-touch attribution per DigitalApplied. A 5-impression campaign lifts brand recall by 15 to 30%, which increases the probability that users convert through a different channel later. Remarketing display converts at 1.91%, well above the 0.71% standard display rate, proving that audience quality changes the conversion math fundamentally.
Display advertising places ads across third-party websites, apps, and CTV platforms via ad networks and DSPs, while social media advertising serves ads within specific platform feeds like Facebook, Instagram, or LinkedIn. Social ads use platform-native audience data from user profiles. Display advertising uses behavioral data, contextual signals, and first-party data across the open web. Both channels complement each other: social builds awareness inside platform environments while display maintains brand visibility across the broader web. Use social media marketing and display together for full-funnel coverage that reaches audiences both inside and outside social platforms.

Related Posts


Comment (1)
Comments are closed.
Jimmie Snopek
August 17, 2021Hi! I’ve been following your site for a long time now and finally got the courage to go ahead and give you a shout out from Humble Tx! Just wanted to say keep up the good work!