




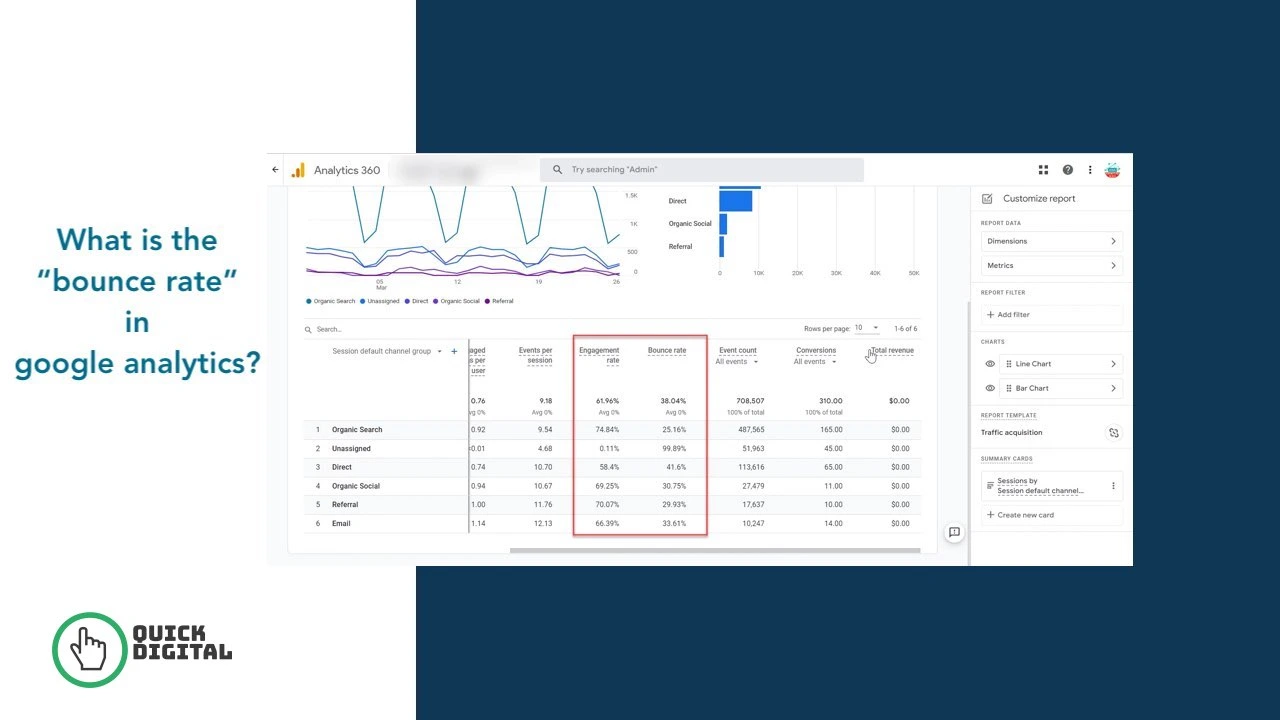
Bounce rate in Google Analytics 4 is the percentage of sessions that were not engaged. A session counts as a bounce when a user spends fewer than 10 seconds on your site, views only 1 page, and triggers zero conversion events. GA4 calculates bounce rate as the exact inverse of engagement rate: Bounce Rate = 100% minus Engagement Rate. This definition replaced the Universal Analytics definition in July 2023 when Google retired UA permanently.
At QuickDigital, we track and optimise bounce rate across client websites spanning B2B services, e-commerce, and content publishing. This guide gives you the GA4-specific definition, the correct formula, current industry benchmarks, and every fix that actually reduces bounce rate at the session level.
The GA4 Bounce Rate Definition: Exactly How Google Defines It
Google Analytics 4 defines bounce rate as the percentage of sessions that are not engaged sessions. This is the official definition from Google’s own Analytics Help documentation. An engaged session in GA4 must meet at least 1 of these 3 criteria:
- The session lasts 10 seconds or longer
- The session includes 2 or more page views or screen views
- The session triggers at least 1 conversion event or key event
If a session meets none of those 3 criteria, GA4 classifies it as an unengaged session. That unengaged session counts as a bounce. A user who spends 4 minutes reading a 3,000-word article and then closes the tab still counts as a bounce in GA4 if they never triggered a second page view or a conversion event, because the 10-second threshold is based on the total session, not read time alone.
This is a counterintuitive but important detail that the original GA4 rollout documentation explains clearly. The is_engaged_session_event parameter has been added to all GA4 events to improve the accuracy of engagement rate and bounce rate calculations across all GA4 properties.
The GA4 Bounce Rate Formula
The exact bounce rate formula in GA4 is: Bounce Rate = (Unengaged Sessions ÷ Total Sessions) × 100.
You can also calculate it directly from engagement rate: Bounce Rate = 100 minus Engagement Rate.
A practical example:
- Your website records 2,000 total sessions in one month
- 1,300 sessions meet at least 1 engaged session criterion
- 700 sessions are unengaged (bounce sessions)
- Engagement rate: 1,300 ÷ 2,000 × 100 = 65%
- Bounce rate: 700 ÷ 2,000 × 100 = 35% (or simply 100 minus 65 = 35%)
| Session Type | Duration Condition | Page Views | Conversion Event | GA4 Classification |
|---|---|---|---|---|
| Engaged session | 10 seconds or more | 1 or more | Not required | NOT a bounce |
| Engaged session | Any duration | 2 or more | Not required | NOT a bounce |
| Engaged session | Any duration | Any number | Yes (at least 1) | NOT a bounce |
| Unengaged session | Under 10 seconds | 1 only | None | BOUNCE |
Universal Analytics Bounce Rate vs GA4 Bounce Rate
Universal Analytics defined bounce rate as any single-page session, regardless of time spent on the page. GA4 changed this definition completely. A user who spent 8 minutes reading a long article and then closed the tab registered as a bounce in Universal Analytics because they viewed only one page. In GA4, that same session counts as an engaged session because it lasted longer than 10 seconds.
This fundamental change makes direct numerical comparison between your old UA bounce rate data and your current GA4 bounce rate invalid. Most websites see GA4 bounce rates run 10 to 20 percentage points lower than their equivalent Universal Analytics figures.
| Platform | Bounce Definition | Time Threshold | Typical Bounce Rate |
|---|---|---|---|
| Universal Analytics (retired July 2023) | Any single-page session, no time factor | None | Higher (often 60 to 80%) |
| Google Analytics 4 (current) | Non-engaged session only | 10-second minimum for engagement | Lower (often 40 to 60%) |
Stop comparing your current GA4 bounce rate against benchmarks published before GA replaced Universal Analytics. Those numbers are structurally incomparable. Any benchmark article citing Universal Analytics data as a current standard gives you misleading targets.
How to Find Bounce Rate in GA4 Reports
GA4 hides bounce rate from default reports and shows engagement rate instead. You must add bounce rate manually to any report where you want to see it. Follow these steps to add bounce rate to your Pages and screens report:
- Sign in to Google Analytics 4 and select your property
- Click Reports in the left navigation panel
- Select Engagement from the left sidebar
- Click Pages and screens to open the report
- Click the pencil icon (Customise report) in the top right corner
- Select Metrics from the right panel that opens
- Click Add metric and type “Bounce rate” in the search box
- Select Bounce rate from the dropdown and click Apply
- Click Save and then Save changes to this report
Bounce rate now appears as a column in your Pages and screens report. You can sort by bounce rate to identify your highest-bouncing pages immediately.
How to Add Bounce Rate to a GA4 Exploration Report
Explorations give you more analytical flexibility than standard reports. Build a free-form exploration with bounce rate by:
- Clicking Explore in the left navigation panel
- Selecting Blank from the template gallery
- Clicking the plus icon next to Metrics in the Variables column
- Searching for and adding Bounce rate, Engagement rate, and Sessions
- Dragging Bounce rate into the Values column of your free-form table
- Adding Page path and screen class as a Row dimension
Explorations let you segment bounce rate by device category, traffic source, country, and custom audience definitions simultaneously, giving you far more diagnostic power than the standard Pages and screens report.
How to Adjust the 10-Second Engagement Timer
The 10-second engagement threshold is the default, not a fixed rule. You can adjust it up to 60 seconds for content-heavy sites where 10 seconds is not enough to classify a genuine reader as engaged.
Access this setting at: Admin → Data Streams → your web data stream → Configure tag settings → Show all → Adjust session timeout → Adjust timer for engaged sessions.
Increase the timer to 30 or 60 seconds on long-form content sites where a 10-second read signals very shallow engagement. Keep it at 10 seconds for service sites and e-commerce sites where 10 seconds of consideration already signals intent.
Bounce Rate Benchmarks by Industry
The cross-industry median GA4 bounce rate sits at approximately 47 to 51% based on Contentsquare data covering billions of sessions. The top-performing quartile achieves bounce rates at or below 36%. That top-quartile figure is the benchmark serious performance marketers target, not the median.
| Industry or Site Type | Typical GA4 Bounce Rate | Interpretation | Primary Fix If Too High |
|---|---|---|---|
| E-commerce (product pages) | 20 to 45% | Users browse multiple products | Improve product page UX and internal links |
| E-commerce (category pages) | 30 to 45% | Filter and browse behaviour | Add filtering, comparison, and related items |
| SaaS and software | 35 to 55% | Users evaluate features and pricing | Improve feature pages and internal linking to demos |
| B2B service websites | 30 to 60% | Varies by funnel stage and page type | Match page content to keyword intent |
| Blog and content sites | 50 to 75% | Readers find answers and leave | Add related post links and email capture |
| News and media | 70 to 90% | One article reads are normal | Add recommended article blocks |
| Landing pages (paid) | 60 to 90% | Single conversion goal pages | Improve page-to-ad message match and load speed |
| Homepages | 30 to 50% | Users should navigate deeper | Improve navigation and above-fold CTAs |
A 75% bounce rate on a news article is the site working correctly. A 75% bounce rate on a SaaS pricing page signals a serious problem. Always evaluate bounce rate relative to page type and industry, never against a single cross-site average.
Bounce Rate by Device Type: The Mobile Gap
Mobile bounce rate runs approximately 12 percentage points higher than desktop bounce rate across all industries. According to benchmark data, mobile sessions bounce at around 51.8% while desktop sessions bounce at 39.7%. This gap has persisted for years despite widespread investment in mobile-first design.
The structural reasons for the mobile-desktop bounce gap include:
- Mobile users browse in interrupted, fragmented contexts such as commuting or waiting
- Mobile page load times are slower than desktop on most websites
- Mobile users land more frequently from social media clicks where intent is casual
- Touch-based navigation has higher friction than mouse-based navigation
- Notification interruptions end mobile sessions before the 10-second threshold
Mobile accounts for approximately 64% of all web traffic. A blended bounce rate of 60% can mask a desktop bounce rate of 40% and a mobile bounce rate of 75% simultaneously. Segment your GA4 bounce rate by device category before drawing any conclusions about your overall performance. Fix page load speed and mobile UX first if your mobile bounce rate runs above 65%.
Bounce Rate vs Engagement Rate in GA4: Key Differences
Bounce rate and engagement rate in GA4 are exact inverses of each other. If your engagement rate is 63%, your bounce rate is 37%. They measure the same sessions from opposite perspectives.
| Metric | Measures | Calculation | GA4 Default Visibility |
|---|---|---|---|
| Engagement rate | Sessions that DID engage | Engaged sessions ÷ Total sessions × 100 | Shown by default |
| Bounce rate | Sessions that did NOT engage | Unengaged sessions ÷ Total sessions × 100 | Hidden by default, must be added |
Google chose to make engagement rate the primary metric in GA4 because it focuses attention on positive signals rather than problems. A rising engagement rate and a falling bounce rate communicate identical information. Use engagement rate for executive reporting. Use bounce rate for diagnostic page-level analysis where you are identifying which specific pages need improvement.
A strong GA4 engagement rate across most industries sits between 60 and 75%. An engagement rate above 75% typically indicates highly relevant, intent-matched content or a well-engaged repeat audience. Track both metrics inside your conversion rate optimisation programme to connect session engagement data directly to revenue outcomes.
8 Real Causes of a High Bounce Rate
High bounce rate consistently traces back to 8 specific failure modes that each require a distinct fix. Identify which cause applies to your high-bouncing pages before choosing a fix.
Cause 1: Slow Page Load Time
Pages that take more than 3 seconds to load lose a measurable percentage of users before the content even appears. Every additional second of load time beyond 3 seconds increases bounce rate by approximately 32% according to Google’s own page speed research.
Fix this by compressing images to WebP format, removing render-blocking JavaScript, enabling browser caching, and using a content delivery network. Run your highest-bouncing pages through Google PageSpeed Insights to identify the specific load time issues causing abandonment.
Cause 2: Content Does Not Match Search Intent
A user who searches “how to fix 404 errors” and lands on a page selling website maintenance services leaves immediately because the page does not satisfy their query. This intent mismatch is the most common structural cause of high bounce rates on pages that rank for informational keywords.
Fix this by auditing every high-bounce landing page against its top organic keyword. Match the page’s opening paragraph, heading structure, and content depth to the intent of that keyword. Informational keywords need educational content. Transactional keywords need purchase or contact paths.
Cause 3: Poor Mobile Experience
Small text, cramped navigation, horizontal scroll, and slow touch responsiveness all cause mobile users to leave in under 10 seconds. With mobile representing over 64% of web traffic, a poor mobile experience alone can push your overall bounce rate above 60%.
Test every high-bounce page on an actual mobile device rather than a desktop browser simulator. Fix tap targets below 48 x 48 pixels, text below 16px font size, and any content that requires pinch-to-zoom to read.
Cause 4: No Clear Next Step on the Page
Pages without visible internal links, related content sections, or calls to action give users no path forward after they finish reading. Users who reach the end of your page with nowhere to go leave, and that exit registers as a bounce.
Add 3 to 5 internal links within the body of every high-bounce page using descriptive anchor text. Add a “related articles” section at the end of blog posts. Also Add a clear primary CTA that matches what a visitor who found this page valuable would logically want to do next.
Cause 5: Misleading Title Tags or Meta Descriptions
A title tag that overpromises or misrepresents the content causes users to bounce immediately when the page fails to deliver what the title suggested. This specific bounce type signals low content quality directly to Google’s quality evaluation systems.
Audit your highest-bounce pages’ title tags against the actual content. Every title tag must accurately represent what the user finds on the page, not what you want them to think they will find.
Cause 6: Intrusive Popups on Landing
Popups that appear within 2 seconds of landing trigger immediate exits. Users who have not had time to evaluate your page’s value will not engage with an email capture form that appears before they have read a single sentence.
Move popups to exit-intent triggers or to appear after the user has scrolled at least 50% of the page. This change alone commonly reduces bounce rate by 5 to 15 percentage points on content pages where immediate popups had been active.
Cause 7: Duplicate Analytics Tags Inflating Bounce Data
A bounce rate below 15% almost always indicates a tracking problem rather than extraordinary user engagement. Duplicate GA4 tags or misconfigured Tag Manager implementations fire events multiple times per session, artificially counting every single-page session as multi-page or event-driven.
If your GA4 bounce rate reads below 15% across your entire site, check Google Tag Manager for duplicate GA4 configuration tags. Use the Tag Assistant Chrome extension to verify that your GA4 tag fires exactly once per page load.
Cause 8: Traffic Source Mismatch
Traffic from display ads, social media, and brand-awareness campaigns naturally bounces at higher rates than organic search traffic because the user intent is weaker and the landing page visit is less pre-qualified.
Segment your GA4 bounce rate by Source / Medium before applying fixes. A 75% bounce rate from display advertising is expected. The same 75% rate from organic search traffic signals a content or intent problem. Fix bounce rate at the traffic source and landing page combination, not as a single blended number across all sessions.
How to Reduce Bounce Rate: 6 Proven Fixes
Reducing bounce rate requires fixing the specific cause for each underperforming page rather than applying generic site-wide changes. Apply fixes in this priority order for the fastest measurable results.
Fix 1: Improve Page Load Speed to Under 3 Seconds
Pass all 3 Core Web Vitals thresholds to eliminate speed-related bounces: LCP under 2.5 seconds, INP under 200 milliseconds, and CLS under 0.1. Every page that fails these thresholds loses users before the content loads. See our complete page load speed guide for the specific technical fixes that move Core Web Vitals scores from failing to passing.
Fix 2: Match Every Page Opening to Its Keyword Intent
Write the first 2 to 3 sentences of every landing page to directly and explicitly answer the query that brings users to that page. Put the most important information first, not after a long introduction. Users who get an immediate, relevant answer stay longer than 10 seconds and count as engaged sessions automatically.
Fix 3: Add Internal Links With Descriptive Anchor Text
Every internal link added to a high-bounce page gives users an additional path forward that can extend their session beyond a single page view. Add links to related service pages, related blog content, and relevant tools within the body of the page. Use keyword-rich anchor text that tells users exactly what they will find on the destination page before they click.
Connect your bounce rate reduction work to your overall website architecture strategy. Pages with strong internal link equity flow in both directions retain users more effectively than isolated pages with no site-wide connection.
Fix 4: Optimise Mobile Page Experience
Test every high-bounce page on a real mobile device. Fix the 4 most common mobile UX failures: text smaller than 16px, tap targets smaller than 48 x 48 pixels, horizontal scroll, and above-fold content covered by fixed headers or cookie banners. Mobile UX improvements reduce the mobile-desktop bounce rate gap from 12 points toward 5 to 7 points on optimised pages.
Fix 5: Restructure Landing Pages for Search Intent
High-bounce landing pages often rank for a keyword but fail to satisfy the underlying intent behind that keyword. Rewrite the page structure to match the format of what is actually ranking for your target keyword. If all top-ranking pages are how-to guides, a sales-focused service page will bounce heavily regardless of its content quality.
Pair this fix with landing page optimisation strategy to align both SEO intent and conversion intent on the same page without sacrificing either objective.
Fix 6: Add Scroll Depth Events as Key Events in GA4
GA4 tracks scroll depth automatically as an event but does not classify it as a key event by default. Mark the scroll event as a key event (formerly conversion event) in GA4 to count deep-scroll sessions as engaged even when users view only 1 page.
Do this at: Admin → Events → toggle the Scroll event to Mark as key event. A user who scrolls 90% of a long blog post now counts as an engaged session rather than a bounce, because they triggered a key event. This configuration change more accurately reflects genuine content engagement on single-page blog visits.
Does Bounce Rate Affect Google Rankings?
Google has confirmed that bounce rate as measured in Google Analytics is not a direct ranking factor. Google does not use GA4 data in its ranking algorithm. The two systems are separate.
The indirect relationship matters, though. A high bounce rate typically indicates a user experience problem like slow load speed, poor mobile design, or content-intent mismatch. Each of those underlying problems does affect rankings through signals Google does measure, such as:
- Core Web Vitals scores measured independently of GA4
- Click-through rate from search results measured in Google Search Console
- Pogo-sticking, where users return to the SERP quickly after clicking your result
- Page experience signals including mobile usability and HTTPS
Fix the root causes of high bounce rate because they genuinely damage user experience and indirectly damage rankings. Do not chase the bounce rate metric itself as a ranking lever. Read our SEO fundamentals guide for a full breakdown of which signals Google actually uses in its ranking algorithm versus which analytics metrics correlate with ranking changes.
Bounce Rate in GA4 and Your Content Marketing Strategy
Bounce rate data from GA4 tells you which content pages satisfy visitor intent and which ones fail. Pages with bounce rates below your industry benchmark are generating genuine engagement. Pages significantly above benchmark need investigation.
Use GA4 bounce rate data to inform your content marketing strategy by:
- Identifying your lowest-bounce pages and replicating their format and structure across new content
- Finding your highest-bounce pages and auditing them for intent mismatch, load speed, and mobile issues
- Segmenting bounce rate by traffic source to identify which acquisition channels bring the most engaged visitors
- Tracking bounce rate changes monthly after publishing content updates to measure improvement
Pages that earn both low bounce rates and strong organic rankings signal to Google that your content genuinely satisfies the search query. This positive engagement signal strengthens your overall E-E-A-T signals across your domain because Google’s quality rater systems treat genuine user engagement as an indicator of content quality and authority.
Frequently Asked Questions About Bounce Rate in Google Analytics
Universal Analytics defined bounce rate as any session where the user viewed only 1 page, regardless of how long they stayed. GA4 defines bounce rate as any session that was not engaged, meaning the user spent under 10 seconds, viewed only 1 page, and triggered zero conversion events. A user who read a 2,000-word article for 8 minutes counted as a bounce in Universal Analytics but counts as an engaged non-bounce session in GA4. This makes GA4 bounce rates 10 to 20 percentage points lower than equivalent UA rates. Never compare GA4 bounce rate data directly against pre-2023 Universal Analytics figures.
GA4 hides bounce rate from default reports and shows engagement rate by default instead. Add bounce rate to your reports by going to Reports, then Engagement, then Pages and screens. Click the pencil icon to customise the report columns, click Add metric, search for Bounce rate, and click Apply. Save the customised report for permanent access. You can also add bounce rate as a metric inside any free-form Exploration report under the Explore section.
A good GA4 bounce rate depends entirely on your industry and page type. E-commerce product pages should achieve below 45%. B2B service pages perform well between 30 and 55%. Blog and content pages naturally run between 50 and 75% because users read one article and leave satisfied. The cross-industry median GA4 bounce rate sits around 47 to 51% based on Contentsquare data. Top-quartile performance across all industries sits at or below 36%. Mobile bounce rates run approximately 12 percentage points higher than desktop bounce rates structurally, so always segment by device before benchmarking.
Google does not use GA4 bounce rate data as a direct ranking signal. Google’s ranking algorithm does not access your Analytics account. The indirect connection is that the underlying causes of high bounce rate, such as slow page load speed, poor mobile UX, and content-intent mismatch, do affect signals Google independently measures like Core Web Vitals, page experience, and pogo-sticking back to search results. Fix the root causes of your high bounce rate because those fixes genuinely improve user experience and ranking performance, not because bounce rate itself moves rankings.
Reduce blog bounce rate by adding internal links to 3 to 5 related posts within the content, adding a related posts section at the end of each article, and marking the scroll event as a key event in GA4 so deep-scroll single-page reads count as engaged sessions. Also ensure your blog post title and opening paragraph directly match the search query intent that brings users to the page. Content-intent mismatch on blog posts creates immediate exits that no design improvement can fix. If your blog bounce rate sits below 50%, you are already outperforming the industry average for content sites.