
Bounce rate in Google Analytics 4 is defined as the percentage of sessions that were not engaged. This means visitors who spent less than 10 seconds on your site, viewed only one page, and didn’t complete any conversion events. Unlike Universal Analytics, GA4 focuses on engagement quality rather than simple page view counts.
GA4 Bounce Rate Calculation Formula
The bounce rate calculation in GA4 uses this simple formula: Bounce Rate = (Non-engaged Sessions ÷ Total Sessions) × 100. Since bounce rate is the inverse of engagement rate, you can also calculate it as 100% minus the engagement rate percentage.
For example, if your website has 1,000 total sessions and 300 were non-engaged, your bounce rate would be 30%. This calculation differs significantly from Universal Analytics, which counted any single-page session as a bounce regardless of time spent.
An engaged session in GA4 occurs when users:
- Spend 10 seconds or more on your site
- View 2 or more pages during their visit
- Complete a conversion event
- Trigger any custom engagement events you’ve configured
| Session Type | Duration | Pages Viewed | Bounce Status |
|---|---|---|---|
| Non-engaged | Less than 10 seconds | 1 page | Bounced |
| Engaged | 10+ seconds | 1+ pages | Not bounced |
| Multi-page visit | Any duration | 2+ pages | Not bounced |
Universal Analytics vs GA4 Bounce Rate Differences
In Universal Analytics, bounce rate is single-page sessions divided by all sessions, or the percentage of all sessions on your site in which users viewed only a single page and triggered only a single request to the Analytics server. This fundamental difference creates significantly different bounce rate calculations between platforms.
Most organizations see lower bounce rates in GA4 than they did in Universal Analytics, mostly due the way that timing now plays a role in calculating bounce rate. The 10-second engagement threshold makes GA4 bounce rates more lenient than Universal Analytics calculations.
| Platform | Calculation Method | Time Factor | Typical Result |
|---|---|---|---|
| Universal Analytics | Single pageview sessions | No time consideration | Higher bounce rates |
| Google Analytics 4 | Non-engaged sessions | 10-second threshold | Lower bounce rates |
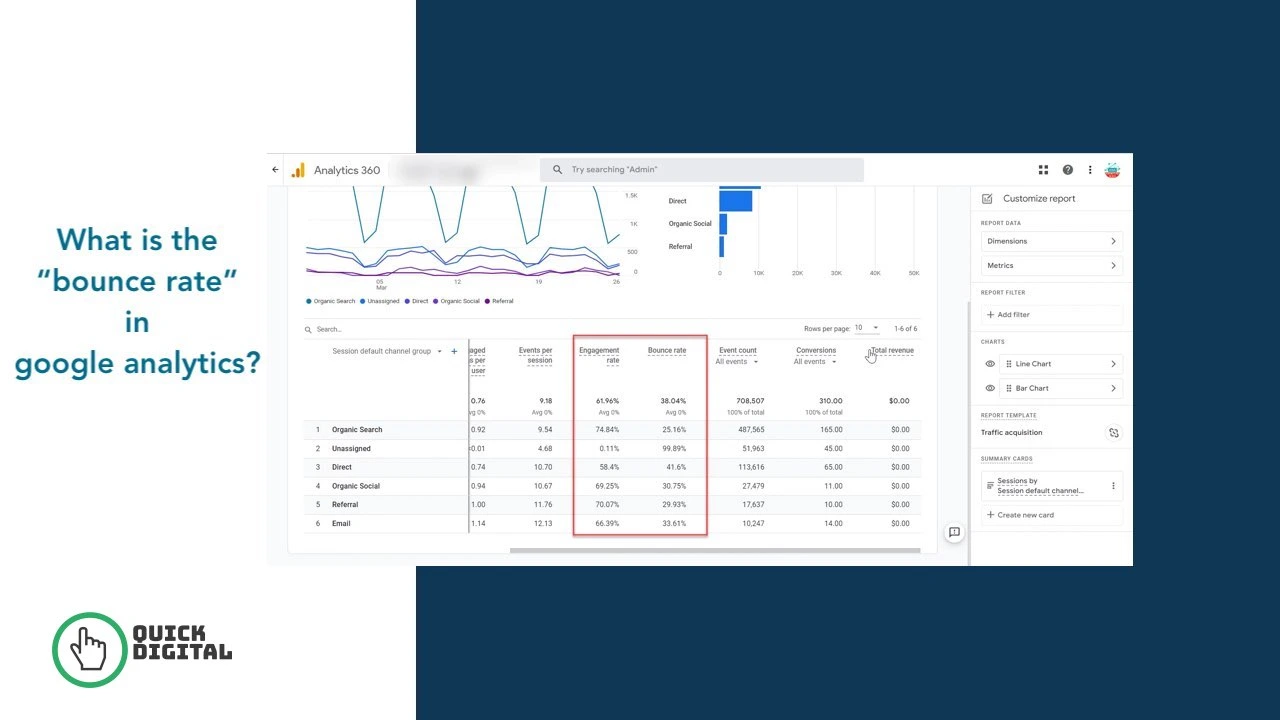
Where to Find Bounce Rate in Google Analytics 4
Many users switched from Universal Analytics expecting to see the same familiar metrics, only to discover that bounce rate isn’t where it used to be. GA4 hides bounce rate by default, prioritizing engagement metrics instead.
To view bounce rate in GA4:
- Navigate to Reports in your GA4 dashboard
- Select Engagement from the left sidebar
- Click on Pages and screens report
- Click the pencil icon to customize columns
- Add “Bounce rate” from the available metrics
- Save your customized report for future reference
Alternatively, you can create custom reports or explorations that include bounce rate as a primary metric. GA4 is much more event and action-oriented than Universal Analytics, which explains why Google introduced engagement rate as the primary focus.
Good vs Bad Bounce Rate Benchmarks
Bounce rate benchmarks vary significantly across industries and website types. Content sites typically show higher bounce rates than e-commerce platforms because users often find their answers quickly and leave satisfied.
General bounce rate guidelines:
- Excellent: 26-40% bounce rate indicates strong user engagement
- Average: 41-55% represents typical website performance
- Poor: 56-70% suggests potential user experience issues
- Concerning: Above 70% may indicate serious problems
Blog posts and informational content naturally have higher bounce rates because users find their answers and leave. E-commerce product pages should maintain lower bounce rates since users typically browse multiple items before purchasing.
Factors That Influence Bounce Rate
Multiple elements affect how users interact with your website and whether they stay engaged beyond their initial page view. Understanding these factors helps you optimize for better user retention.
Page Load Speed Impact
Slow-loading pages directly increase bounce rates because users abandon sites that take too long to display content. Pages loading in under 3 seconds retain significantly more visitors than slower alternatives.
Content Quality and Relevance
Content matching user search intent reduces bounce rates by providing exactly what visitors expect. Misleading titles or irrelevant content causes immediate exits, increasing your bounce percentage.
Mobile Optimization
Mobile-unfriendly websites experience higher bounce rates because mobile users expect fast, responsive experiences. Poor mobile design frustrates users and drives them away quickly.
Website Navigation
Clear navigation menus and internal linking encourage users to explore additional pages. Confusing site structure increases bounce rates by making it difficult for users to find related content.
How to Improve Your Bounce Rate
Reducing bounce rate requires addressing specific user experience problems that cause visitors to leave without engaging. Focus on immediate improvements that enhance user satisfaction and encourage deeper exploration.
Optimize Page Loading Performance
Implement these technical improvements to reduce page abandonment:
- Compress images and optimize file sizes
- Enable browser caching for returning visitors
- Minimize HTTP requests through code optimization
- Use content delivery networks (CDNs) for faster global access
Consider implementing professional page load speed optimization strategies to maximize performance improvements.
Enhance Content Strategy
Create content that matches user search intent and encourages further exploration:
- Write compelling introductions that immediately address user questions
- Include related article suggestions within content
- Add internal links to relevant pages naturally
- Structure content with clear headings and scannable formatting
Effective content marketing strategies can significantly improve user engagement and reduce bounce rates across your website.
Improve User Experience Design
Design elements that encourage continued browsing include:
- Clear calls-to-action that guide user behavior
- Related content recommendations
- Easy-to-use navigation menus
- Search functionality for large websites
Bounce Rate vs Engagement Rate in GA4
In GA4, the bounce rate represents the percentage of sessions that did not involve engagement. These metrics work as inverse calculations, meaning high engagement rates correspond to low bounce rates.
GA4 prioritizes engagement rate because it provides more actionable insights than traditional bounce rate measurements. Engagement rate shows positive user behaviors rather than focusing on negative actions like leaving immediately.
| Metric | Measurement Focus | Calculation | Actionability |
|---|---|---|---|
| Bounce Rate | Non-engaged sessions | Percentage of unengaged visits | Identifies problems |
| Engagement Rate | Engaged sessions | Percentage of meaningful interactions | Shows success metrics |
Common Bounce Rate Misconceptions
Many website owners misunderstand bounce rate implications and make incorrect optimization decisions based on incomplete information. High bounce rates don’t always indicate poor performance, especially for specific content types.
Single-Page Success Stories
Contact pages, support articles, and product specification pages often have high bounce rates because they fulfill user needs immediately. Users find their answers and leave satisfied, which represents successful user experience rather than failure.
Industry-Specific Variations
Different industries naturally experience varying bounce rate patterns:
- News websites: 70-90% (users read one article and leave)
- E-commerce sites: 20-45% (users browse multiple products)
- Service businesses: 30-60% (depends on information depth)
- Landing pages: 60-90% (designed for single conversions)
Technical Implementation and Tracking
Proper bounce rate tracking requires correct Google Analytics implementation and understanding of how different website elements affect calculations. Events, goals, and custom tracking influence bounce rate measurements.
Event Tracking Impact
Custom events affect bounce rate calculations in GA4 by potentially converting non-engaged sessions into engaged ones. Video plays, downloads, and form interactions can reduce bounce rates when properly tracked.
Professional SEO optimization services can help implement proper tracking configurations that provide accurate bounce rate measurements.
Goal Configuration Effects
Setting up appropriate goals and conversion events helps distinguish between truly unengaged users and those who complete desired actions quickly. This creates more meaningful bounce rate interpretation for business decisions.
Bounce Rate Analysis for Different Page Types
Different page types require unique bounce rate evaluation approaches because user behavior patterns vary significantly based on content purpose and user intent.
Homepage Analysis
Homepage bounce rates between 30-50% typically indicate healthy user distribution across your website. Higher rates suggest navigation problems or content misalignment with user expectations.
Blog Post Performance
Blog articles naturally have higher bounce rates because readers often find complete answers within single posts. Focus on engagement time rather than pure bounce rate numbers for content evaluation.
Product Page Optimization
E-commerce product pages should maintain bounce rates below 40% since users typically compare multiple products before purchasing. High bounce rates on product pages indicate potential pricing, description, or user experience issues.
Effective conversion rate optimization strategies can help reduce product page bounce rates and increase sales performance.
Advanced Bounce Rate Optimization Strategies
Beyond basic improvements, advanced optimization techniques can significantly impact bounce rate performance through strategic content and technical enhancements.
Internal Linking Strategies
Strategic internal linking reduces bounce rates by providing clear paths to related content. Link to relevant articles, product categories, or service pages that match user interests and search intent.
Implementing comprehensive website architecture best practices helps create logical content flow that encourages continued browsing.
Personalization Techniques
Personalized content recommendations based on user behavior, location, or previous visits can significantly reduce bounce rates by showing relevant information that matches individual user preferences.
Exit-Intent Technology
Exit-intent popups and interventions can capture users before they leave, offering related content, email subscriptions, or special offers that encourage continued engagement with your website.
Measuring Bounce Rate ROI and Business Impact
Bounce rate improvements translate into measurable business benefits through increased page views, longer session durations, and higher conversion rates. Track these metrics together for comprehensive performance evaluation.
Calculate bounce rate improvement ROI by measuring:
- Increased average session duration
- Higher pages per session ratios
- Improved conversion rates from engaged users
- Enhanced user lifetime value metrics
Professional PPC management services can help optimize landing page bounce rates for paid traffic campaigns.
Frequently Asked Questions
A good bounce rate typically ranges between 26-55%, depending on your industry and website type. Content sites naturally have higher bounce rates than e-commerce platforms because users often find complete answers in single articles.
GA4 calculates bounce rate as the percentage of sessions that are not engaged. Sessions become engaged when users spend 10+ seconds on site, view multiple pages, or trigger conversion events.
GA4 hides bounce rate by default in favor of engagement metrics. You can add bounce rate to reports by customizing columns in the Pages and screens report or creating custom explorations.
Universal Analytics counted any single-page session as a bounce, while GA4 requires 10+ seconds of engagement to avoid bounce classification. This makes GA4 bounce rates generally lower than Universal Analytics measurements.
Bounce rate itself doesn’t directly impact SEO rankings, but it indicates user experience quality that search engines value. High bounce rates may suggest content doesn’t match search intent, which can indirectly affect rankings.
Improve page loading speed, enhance content relevance, optimize mobile experience, and add clear internal linking to reduce bounce rates. Focus on matching user search intent with your content to keep visitors engaged longer.
Slow loading times, poor mobile optimization, irrelevant content, and confusing navigation are primary causes of high bounce rates. Technical issues and content misalignment with user expectations drive immediate exits.
Blog posts naturally have higher bounce rates because readers often find complete answers within single articles. Focus on engagement time and return visitor metrics rather than bounce rate alone for blog content evaluation.
Conclusion
Understanding bounce rate in Google Analytics helps you measure user engagement and identify optimization opportunities. GA4’s engagement-focused approach provides more meaningful insights than traditional bounce rate calculations, emphasizing quality interactions over simple page view counts.
Monitor bounce rate alongside other engagement metrics like session duration and pages per session for comprehensive user behavior analysis. Focus on creating valuable content that matches search intent while optimizing technical performance to keep users engaged.
Regular bounce rate analysis combined with strategic improvements in content quality, page speed, and user experience design will help you build a more engaging website that better serves your audience needs and business objectives.