


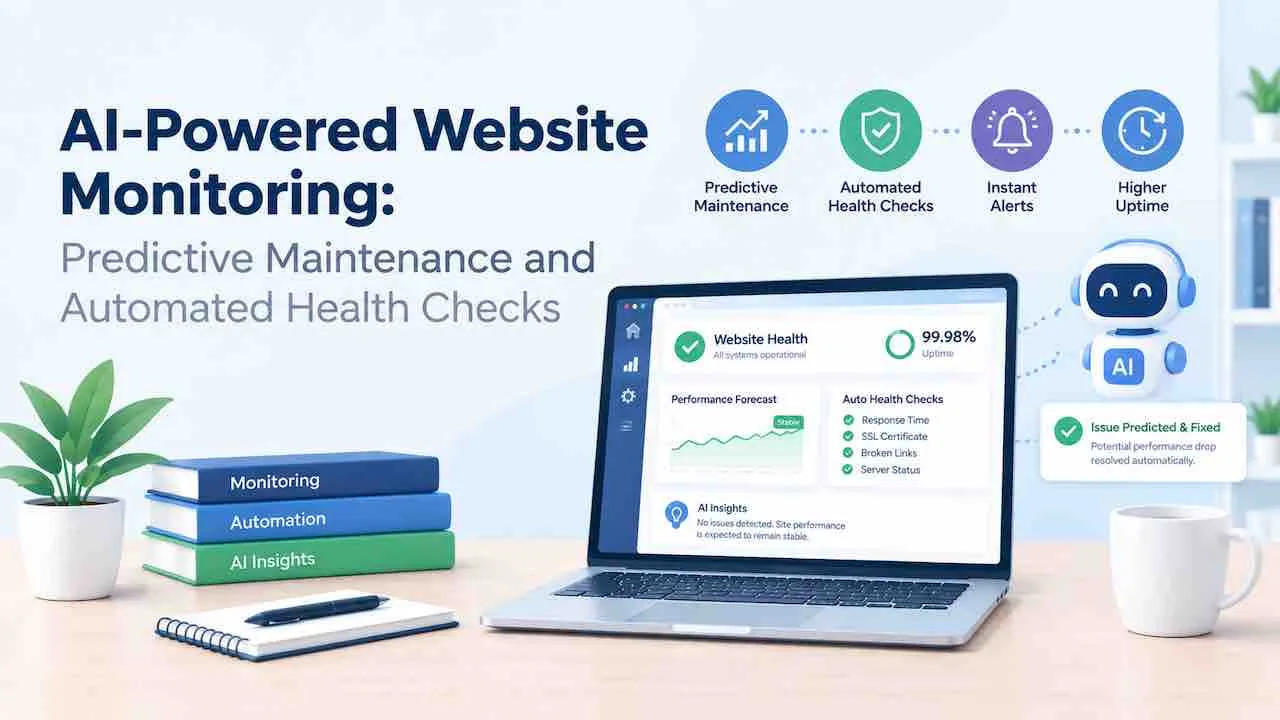
AI website monitoring uses machine learning to detect performance drops before users see them. Automated health checks verify specific user flows run correctly at scheduled intervals. Together, they give your team full-stack visibility with predictive alerts. Sites using intelligent website monitoring cut mean time to detect by up to 80%. This figure comes from vendor benchmarks published by Datadog and New Relic. Traditional ping tools alert after failure. AI-powered website monitoring acts before failure reaches a single visitor. Pair it with professional website maintenance services to act on every alert with a documented remediation process.
AI Website Monitoring vs Traditional Monitoring
Traditional monitoring fires an alert after a failure has occurred. AI website monitoring predicts and detects degradation before users are affected.
| Feature | Traditional Monitoring | AI Website Monitoring |
|---|---|---|
| Detection method | Fixed threshold rules | Machine learning anomaly detection |
| Alert timing | After failure occurs | Before users are affected |
| False positive rate | High (noisy alerts) | Low (pattern-aware filtering) |
| Traffic pattern awareness | None | Learns daily and weekly baselines |
| Root cause identification | Manual investigation | Automated log analysis and correlation |
| Security threat detection | Signature-based only | Behavioral anomaly detection |
| Incident response speed | Slow (manual triage) | Fast (automated remediation triggers) |
Smart website monitoring learns your traffic patterns, load cycles, and error rates over time. It flags deviations outside normal variance. It acts before a hardcoded performance threshold is even crossed. Website monitoring with machine learning replaces guesswork with data-driven detection.
Automated Health Checks vs Continuous Monitoring
These two terms are used interchangeably but describe different approaches. Understanding the difference helps you deploy both correctly.
Automated health checks are scheduled tests that simulate a specific user action and verify the result. A login flow synthetic test sends a real POST request with test credentials. It verifies a 200 response with the expected session token. A checkout synthetic test completes a full cart-to-payment-gateway sequence. It confirms the expected output at each step. These tests run every 1 to 5 minutes from external probe locations. They catch functional failures that passive metric monitoring misses entirely.
Continuous website monitoring watches passively by collecting metrics from your live traffic. It measures TTFB, error rates, CPU usage, and database query times on every real request. It detects degradation trends over time. It does not simulate user actions; it observes what real users are already experiencing.
AI-powered website monitoring combines both. The machine learning layer sits on top of automated health checks and continuous metric streams. It learns what normal looks like for each, then alerts when either deviates from baseline.
| Capability | Automated Health Checks | Continuous AI Monitoring |
|---|---|---|
| Detects functional failures | Yes (simulates real actions) | Only if they affect metrics |
| Detects performance degradation | Partially (response time only) | Yes (full metric stack) |
| Detects security anomalies | No | Yes (behavioral detection) |
| Alert on regional outages | Yes (runs from global probes) | Depends on RUM coverage |
| Learns from historical patterns | No (static pass/fail) | Yes (dynamic baseline) |
| Best for | Critical user journeys | Infrastructure and trend detection |
How AI Website Monitoring Works
AI-powered website monitoring runs 4 continuous phases in a closed loop. Each phase feeds the next with live data.
Phase 1: Data Collection Across All Layers
The monitoring agent collects data from every layer of your stack simultaneously. It reads server response times, server errors, and DNS resolution times. It tracks SSL certificate expiry dates, broken link counts, and page load speed metrics. Database query durations feed the same data pipeline. Real user monitoring (RUM) captures actual visitor experience data. Synthetic monitoring runs automated health checks from 10 to 50 probe locations every 60 to 300 seconds. Both streams feed the machine learning model that powers website anomaly detection. Continuous website monitoring means no gaps in data collection, day or night.
Phase 2: Baseline Learning and Pattern Recognition
The AI builds a dynamic baseline for each metric by time of day and day of week. A 400ms TTFB at 3 AM is normal for many sites. The same TTFB at peak hours signals a problem. Automated performance monitoring removes alert fatigue by suppressing alerts during expected traffic spikes. The model uses anomaly detection algorithms such as isolation forest and LSTM. These separate normal variance from real degradation signals. Machine learning website monitoring becomes accurate only after 7 to 14 days of baseline learning. Real-time website monitoring that fires before the baseline is set generates false positives that destroy team trust.
Phase 3: Automated Alerting and Incident Detection
When the AI detects a deviation beyond the learned baseline, it fires a prioritized alert. The alert includes the affected URL and the metric that deviated. It names the likely source layer, such as database, CDN edge, or application server. This automated incident detection cuts mean time to resolve (MTTR). Engineers start with context, not a blank screen. A website health monitoring dashboard shows all active incidents, severity scores, and trend history in one view. Intelligent website monitoring routes P1 alerts to PagerDuty or OpsGenie for on-call escalation. A minor CLS drift logs to a weekly digest. Real-time AI website alerts stop losing revenue by notifying teams within seconds of a deviation.
Phase 4: Automated Remediation and Log Analysis
Advanced AI website monitoring triggers automated remediation scripts on specific conditions. Common automated actions include cache purges when stale content is detected. Server restarts fire when memory usage crosses a learned ceiling. CDN failover activates when origin response time degrades beyond a set performance threshold. Automated website monitoring removes the need for manual log analysis on high-traffic sites. The system correlates a PHP memory spike with a specific plugin call. It surfaces these findings as actionable incident reports within minutes.
What AI Monitors on Your Website
AI-powered website monitoring covers 6 distinct layers. Each layer feeds a separate alert stream with its own learned baseline.
Uptime and Availability Monitoring
Automated uptime monitoring runs continuous synthetic requests from probe locations worldwide. It calculates real availability percentage per region separately. A site may show 99.9% global uptime while being unreachable in Southeast Asia for 4 hours. AI uptime monitoring detects regional outages, CDN edge failures, and partial availability states. Simple ping monitors miss all of these. Website uptime monitoring at this level is the baseline requirement for any revenue-generating site. Website downtime prevention starts with detecting failures before customers do.
Performance and Core Web Vitals Monitoring
AI website performance monitoring tracks page load speed, TTFB, and LCP continuously. It monitors cumulative layout shift (CLS) against Google’s published thresholds. LCP must stay under 2.5 seconds. TTFB must stay under 800 milliseconds. CLS must stay under 0.1. The AI detects when a deployment caused performance degradation. It compares post-deploy metrics against the stored baseline. Sites that improve page load speed before setting their baseline get sharper regression detection after every update. Website performance monitoring integrated with your deployment pipeline audits every code push automatically. Structured Core Web Vitals maintenance stores pre-deployment baseline scores for comparison after each release.
Security and Vulnerability Monitoring
AI-powered security monitoring detects behavioral threats that signature databases cannot catch. The system learns normal login frequency, file modification patterns, and data transfer volumes per hour. Deviations from these norms trigger immediate alerts. Automated alerting fires when login attempt rates spike beyond normal variance. It fires when file modification timestamps change outside scheduled maintenance windows. It fires when outbound data transfer exceeds baseline by more than 3 standard deviations. Security vulnerabilities in plugins and themes create detectable anomalies before exploitation occurs. Website security maintenance combined with AI monitoring creates a proactive defense layer. SSL certificate management with automated renewal alerts removes the risk of certificate lapse entirely.
SEO and Technical Health Monitoring
AI website monitoring tracks crawlability, indexability, broken links, redirect chains, and structured data validity continuously. A single plugin update that breaks your XML sitemap can erase months of rankings. Automated health checks catch these regressions within hours of the triggering event. Bounce rate spikes 30% or more within an hour of a crawl error on key pages. Technical SEO maintenance paired with continuous monitoring protects your search visibility between manual audit cycles.
JavaScript and Browser Monitoring
JavaScript errors and browser-side failures are invisible to server-level monitoring. AI browser monitoring collects JavaScript exception rates, long task durations, and INP scores from real user sessions. A broken JavaScript bundle after a deployment shows no 5xx errors at the server level. Yet every user on the page experiences a non-functional interface. Browser monitoring catches this class of failure within minutes of a bad deploy. It tracks JS error rates by browser version, device type, and geographic region. Single-page application (SPA) sites depend on this layer entirely. Their server responses are always 200 even when the app is broken.
Infrastructure and Server Monitoring
Application performance monitoring (APM) tracks server CPU, RAM, database query time, and hosting resources per process. The AI model identifies which query, cron job, or process caused a resource spike. Infrastructure monitoring at this granularity separates proactive website maintenance from reactive firefighting. A query that slows from 80ms to 1,200ms after a plugin update triggers an automated AI flag. The AI names the plugin that registered it.
Top AI Website Monitoring Tools
These 7 platforms lead the AI website monitoring market by feature depth and machine learning maturity.
| Tool | AI/ML Feature | Best For | Probe Locations |
|---|---|---|---|
| Datadog | Watchdog anomaly detection, predictive analytics | Enterprise infrastructure and APM | 30+ |
| New Relic | Applied Intelligence, automated incident correlation | Full-stack observability | 20+ |
| Site24x7 | AI-based anomaly detection, root cause analysis | SMB to enterprise, website plus infrastructure | 130+ |
| Pingdom | Smart alerting with baseline learning | Website uptime and user experience | 100+ |
| Uptime Robot | Automated alerting, multi-step monitoring | Budget-friendly uptime monitoring | 7+ |
| Dynatrace | Davis AI engine, full causation mapping | Complex enterprise environments | 20+ |
| Better Uptime | Incident timeline, smart alert grouping | Developer teams and SaaS products | 10+ |
Datadog and Dynatrace lead for predictive website monitoring at enterprise scale. Site24x7 delivers the broadest AI website monitoring tools coverage per dollar for SMBs. Pingdom and Uptime Robot deploy fastest for teams that need website availability monitoring without infrastructure complexity.
Key Metrics AI Website Monitoring Tracks
AI-powered website monitoring assigns a learned baseline to each metric. It alerts only when deviation exceeds normal variance for that specific time of day and traffic level.
| Metric | Target Threshold | Alert Trigger |
|---|---|---|
| Uptime percentage | 99.9%+ | Any downtime exceeding 2 consecutive minutes |
| TTFB | Under 800ms | 30% above baseline average |
| LCP | Under 2.5 seconds | Crosses 2.5s threshold |
| CLS | Under 0.1 | Crosses 0.1 threshold |
| Error rate (5xx) | Under 0.1% | 3x above baseline error rate |
| SSL expiry | 30+ days remaining | Under 30 days, then 14, then 7 |
| Broken links | 0 | Any new 404 on crawled pages |
| Database query time | Under 100ms average | 50% above baseline query time |
| Server CPU | Under 70% average | Sustained 90%+ for 5 minutes |
| Traffic anomalies | Baseline ± 30% | Sudden spike or drop beyond learned range |
| JS error rate | Under 0.5% of sessions | 3x above baseline JS exception rate |
Uptime SLA Reference Table
Your uptime SLA target directly determines how much downtime per month your monitoring budget must prevent. Use this table to set your alert response time targets.
| Uptime SLA | Allowed Downtime Per Month | Allowed Downtime Per Year | Typical Use Case |
|---|---|---|---|
| 99% | 7h 18m | 87h 36m | Low-traffic informational sites |
| 99.9% | 43m 49s | 8h 45m | Business sites, lead generation |
| 99.95% | 21m 54s | 4h 22m | Ecommerce, SaaS platforms |
| 99.99% | 4m 22s | 52m 35s | High-revenue ecommerce, fintech |
| 99.999% | 26s | 5m 15s | Enterprise, mission-critical apps |
AI website monitoring directly improves 2 operational KPIs: mean time to detect and mean time to resolve. Every minute of undetected downtime means losing revenue. Website maintenance reporting with MTTD and MTTR trends gives a measurable ROI figure for monitoring investment.
How to Set Up AI-Powered Website Monitoring
A complete AI website monitoring setup runs in 7 steps and takes under 4 hours.
- Step 1: Audit your current monitoring gaps. List every layer your current tools miss: security behavior, SEO health, database query time, and regional availability. Use a website maintenance checklist to map each gap to a monitoring category before choosing a platform.
- Step 2: Select your AI monitoring platform. Match platform depth to your stack. WordPress and WooCommerce sites run well on Site24x7 or Pingdom. Enterprise stacks on complex cloud infrastructure need Datadog or Dynatrace for full-stack APM.
- Step 3: Install agents and configure synthetic monitors. Deploy the monitoring agent on your server. Set up automated health checks for your 3 to 5 most critical user flows. Set probe intervals at 60 seconds for critical paths like checkout, login, and your primary lead form.
- Step 4: Connect monitoring to your CI/CD pipeline. Hook your monitoring platform into your deployment workflow. GitHub Actions and Jenkins both support post-deploy monitoring triggers. A deploy that increases TTFB by 30% above baseline should auto-trigger a rollback gate. This turns AI monitoring into an active deployment quality control layer.
- Step 5: Let the AI build its baseline. Run automated website monitoring for 7 to 14 days without modifying alert thresholds. The machine learning model needs full weekday and weekend traffic cycles before predictive website monitoring is reliable.
- Step 6: Configure tiered alert routing. Route P1 alerts (downtime, 5xx spikes, security anomalies) to PagerDuty or OpsGenie for on-call escalation. Route P2 alerts (performance degradation, slow queries) to Slack or email. Route P3 items (broken links, minor CLS shifts) to a weekly digest. This eliminates alert fatigue from day one.
- Step 7: Connect monitoring to your backup and status page workflow. An alert without a recovery path is noise. Connect your monitoring platform to your website backup strategy. A critical alert should trigger a backup verification before any rollback begins. Publish live incident updates to a public status page like Statuspage.io or Cachet immediately. Customers should see the same information your team sees, in real time.
AI Website Monitoring for WordPress and WooCommerce
WordPress and WooCommerce sites have unique monitoring needs. Plugin and theme updates run on irregular schedules and can break performance without warning. WordPress website monitoring with AI creates an automated safety net around every update cycle. WordPress website maintenance paired with AI monitoring catches regressions before users report them.
What to Monitor on WordPress Specifically
- Plugin update events. Each plugin activation triggers an immediate performance scan. A 20% TTFB increase within 5 minutes of a plugin update points to that plugin. A slow website after an update needs a structured diagnostic, not manual guesswork.
- Autoloaded data in wp_options. AI monitoring tracks the total autoloaded data size in the WordPress database. When it exceeds 800KB, page generation time slows measurably. Automated alerting fires before degradation becomes user-visible.
- PHP memory and execution time. WordPress sites frequently hit PHP memory limits after a major update. AI monitoring tracks PHP memory usage trends. It alerts before fatal memory exhaustion errors appear in the log.
- WP-Cron queue length. A growing backlog of unprocessed cron events causes intermittent slowness. Continuous website monitoring tracks cron queue length as a leading indicator of background processing problems.
WooCommerce-Specific Monitoring Points
WooCommerce website maintenance demands tighter monitoring tolerances. Checkout failures translate directly to lost orders and losing revenue. AI monitoring for WooCommerce tracks 4 additional transaction-critical metrics.
- Checkout page TTFB. Checkout pages hit the database harder than content pages. A TTFB above 1,200ms on checkout causes measurable cart abandonment rate increases.
- Payment gateway response time. Monitor the API response time from your payment processor. A gateway latency spike costs conversions even when your server is healthy.
- Cart-to-order conversion rate as a signal. A sudden drop in this rate is a behavioral anomaly signal. Something is broken in the checkout flow, even if no 5xx errors appear in server logs.
- Session and cookie errors. WooCommerce cart persistence depends on cookies and sessions. Session handler errors after a PHP update break carts silently. AI monitoring catches the error rate spike before customers report lost carts.
How AI Monitoring Reduces Alert Fatigue
Alert fatigue is the single biggest reason monitoring programs fail. Teams that receive 200 alerts per day stop reading them. AI website monitoring solves alert fatigue through 3 mechanisms traditional tools cannot replicate.
First, dynamic baseline suppression silences alerts for expected behavior. A traffic spike during a scheduled email campaign is not an anomaly. The AI knows your send schedule from historical data and suppresses the associated load increase. Second, alert correlation groups related events into a single incident. A CDN failure that triggers 500 simultaneous availability alerts becomes 1 incident card with full context. Third, severity scoring routes alerts by business impact. The AI scores each alert by the revenue impact of the affected page. It routes accordingly, not alphabetically.
The result is a monitoring program engineers actually respond to. Every alert is specific, contextualized, and actionable.
Predictive Maintenance vs Reactive Maintenance
Predictive website maintenance acts on trend data before failure. Reactive maintenance acts after users report a problem. Predictive maintenance for websites requires a baseline of 14 to 30 days. It pays back in the first prevented outage.
| Factor | Predictive Maintenance | Reactive Maintenance |
|---|---|---|
| When action is taken | Before failure, on trend signals | After failure is reported |
| Downtime duration | Minutes (caught early) | Hours (diagnosis from scratch) |
| Revenue impact | Near zero (prevented) | High (users already affected) |
| Team stress | Low (planned response) | High (emergency response) |
| Data requirement | Historical trend data required | None needed |
| Tool complexity | Higher (AI platform needed) | Lower (basic uptime tool) |
Proactive website monitoring requires historical trend data before the predictive layer becomes reliable. Sites losing 4 hours of availability monthly spend more on lost revenue than enterprise monitoring costs per year.
When an AI Monitoring Alert Fires: Response Protocol
A documented response protocol turns an alert into a resolved incident in under 30 minutes.
| Alert Type | First Action | Second Action | Resolution Path |
|---|---|---|---|
| Full downtime (5xx) | Verify backup is current | Read error log for fatal errors | Rollback or hotfix deploy |
| TTFB spike | Monitor server CPU and RAM | Run database query analysis | Optimize query or scale resource |
| LCP regression | Identify changed assets | Run PageSpeed Insights scan | Compress images, fix render blocking |
| JS error spike | Identify the failing script | Roll back the last JS deploy | Fix exception and redeploy |
| Security anomaly | Block flagged IP range | Scan for file modifications | Restore clean backup if compromised |
| SSL expiry warning | Renew certificate immediately | Verify auto-renewal config | Fix renewal automation |
| Traffic anomalies (drop) | Verify indexability in GSC | Scan for robots.txt changes | Restore crawlable state |
Post each active incident to a public status page immediately. Customers who see live incident updates generate 60% fewer support tickets, per Atlassian Statuspage research. Automated incident detection feeds a status page update instantly. This creates a closed loop from alert to communication in under 2 minutes.
AI Website Monitoring ROI and Cost Justification
The business case for AI-powered website monitoring is direct. Measure the cost of one undetected outage against the annual monitoring cost.
A site generating $50,000 per month loses approximately $69 per minute during downtime. A 4-hour outage costs $16,560 in lost revenue. Gartner and IBM estimate average downtime costs at $5,600 to $22,000 per hour for ecommerce operations. Enterprise AI monitoring platforms range from $200 to $2,000 per month. A single prevented 4-hour outage pays for 8 to 82 months of monitoring. Website maintenance cost analysis consistently shows automated monitoring as the highest-ROI line item in a maintenance budget.
AI search engines crawl sites continuously. A Perplexity, ChatGPT, or Gemini crawler visit during downtime removes pages from AI-generated answers for days. Website maintenance for AI search treats uptime as a prerequisite for AI search visibility. Sites that maintain 99.9%+ uptime consistently appear more frequently in AI-generated citations than those with irregular availability.
Need AI-Powered Monitoring Set Up for Your Site?
Quick Digital has managed website performance monitoring since 2014. We configure predictive monitoring, automated health checks, alert routing, and incident response workflows tailored to your stack.
Get a Free QuoteFrequently Asked Questions
AI website monitoring collects metric data from your server, application, and user sessions continuously. It builds a baseline of normal behavior over 7 to 14 days. It then uses machine learning algorithms like isolation forest and LSTM to detect anomalies in that data. When a metric deviates beyond the learned baseline, it fires a prioritized alert with root cause context. Automated health checks verify specific user flows run correctly alongside this passive metric stream.
Traditional uptime monitoring pings your server on a fixed interval and alerts when it stops responding. AI website monitoring learns your site’s behavioral baseline across performance, security, SEO, and infrastructure layers. It detects degradation trends and anomalies before they cause downtime. The result is earlier detection, fewer false positives, and root cause context with every alert. Traditional tools deliver only a binary up/down notification.
Site24x7, Pingdom, and Datadog are the strongest AI website monitoring tools for WordPress sites. Site24x7 provides the broadest monitoring coverage at a mid-range price. Pingdom excels at real user monitoring and user experience metrics. Datadog is the choice for WordPress on complex cloud infrastructure. It covers full-stack APM and automated health checks at scale.
Most AI website monitoring platforms need 7 to 14 days of data to build a behavioral baseline. This period must cover at least one full weekly traffic cycle. Run automated website monitoring without modifying default alert thresholds during this phase. The AI captures your true normal traffic and performance variance before anomaly detection becomes reliable. Predictive analytics kick in reliably only after this learning window closes.
AI website monitoring cannot prevent all downtime. It reduces outage duration by 60 to 80% in most deployments, per Datadog and New Relic benchmarks. Predictive website maintenance catches performance degradation trends 15 to 60 minutes before full failure in most cases. Some failure types resolve before any human intervention when paired with automated remediation scripts. Cache purges and server restarts are the most common automated actions. Website downtime prevention at this level requires both automated health checks and continuous AI monitoring running together.